A Sliding Friction Lab that Hits the Sweet Spot
Labs are awesome. But labs are also a lot of work for students and for teachers, so I strive to ensure that labs are worth the effort. Here are the boxes a lab needs to check for me.
Lab Must-Haves
- Students have choice in what they analyze so it can be something of interest to them. This helps reinforce the idea that physics is relevant to their lives.
- The question students analyze has an interesting answer, not something they can easily answer by a google search.
- Grading needs to be relatively easy. More time grading means less time I have for other teaching and non-teaching activities.
- Minimal set-up time for the teacher. Again, sometimes lots of lab set-up time is inevitable, but there’s a limit to the amount of time I have to do lab set up.
- Favorable ratio of good science compared to overhead, tedium, and cognitive load. I want students to be working on investigative skills and analysis, not bogged down with tasks that don’t relate to the science at hand.
- Independent work: I like to be able to assess students’ individual work with lab skills like graphing, data analysis, and defending an argument with evidence.
How to do a Friction Coefficient Lab
Here’s the lab that falls right in the sweet spot. I used the Pivot Interactives Friction Coefficient Video Upload Activity as a framework to guide the students (and me!) because it includes all the instructions, video analysis, and graphing tools. Ask students to record a video of an object sliding on a surface so that it is being slowed by friction.
Friction Coefficient Lab Main Questions
Students will use their video to answer three questions
- What is the coefficient of friction between the object and the surface?
- How does your measured value compare with published values for similar surfaces?
- Is the friction force dependent on the velocity of the object?
How Student Video-Upload Works
Students upload their video into a video analysis app. I use Pivot Interactives because it makes this lab a breeze and is extremely well suited for this. Students measure position and time data for at least 10 data points while the object is being accelerated by friction. Next, they construct a velocity vs time graph. Some students also used an acceleration vs time graph.
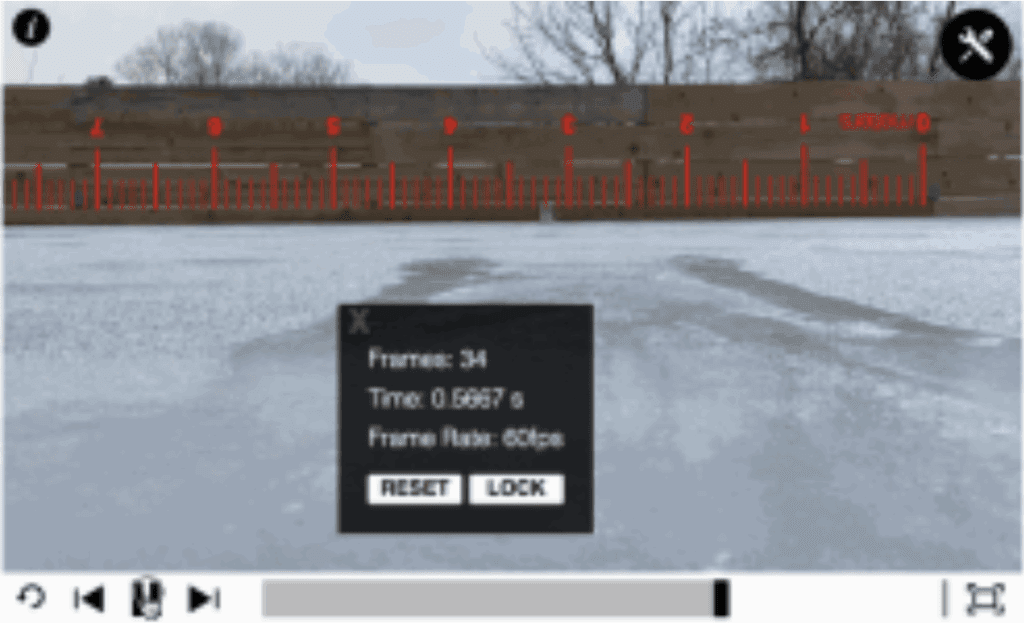
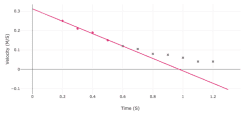
Nathan had to lay down the ice to record this shot of an aluminum coffee pot sliding across an ice rink, but his efforts paid off with some nice data. He was a little surprised that the coefficient of friction was as high as 0.19. But it was very cold and the ice was not particularly smooth. Notice the constant acceleration, indicating that the coefficient of friction was not changing as the velocity of the object decreased. Most students’ data showed nearly constant acceleration, which provides support that the simplified model for friction that we use in class is valid for many situations.
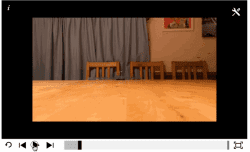
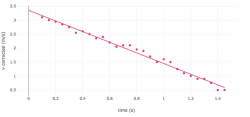
Noah recorded an ice cube sliding across a wooden table. (Minnesota kids are thinking about ice this time of year.) He said he recorded and analyzed several trials before settling on this one. His analysis showed that the slope of the velocity vs time graph decreased as the ice slowed down.
Noah was curious about this, since it didn’t match the model for friction that we use to solve word problems in class. In his lab report, he wrote what he’d learned about how motion through liquids differs from objects sliding on dry surfaces.
Students also analyzed hockey pucks, cars speeding up and slowing down on icy parking lots (with a teacher-imposed speed limit of 5 mph), and lots of amusing objects sliding across desks and countertops.
Why I Use Pivot Interactives for Video Analysis
While there are several options for video analysis. Pivot Interactives is particularly well-suited for this activity.
- The instructions for the lab are build into the activity.
- Students can upload video straight from their phone into Pivot Interactives, and then complete the activity in the same app. All the students’ work — video, data, graphs and written analysis — is in one place, making it easy to keep organized.
- Making a data table and graphs is very simple and quick for students. Making a velocity vs time graph is particularly slick.
- The teacher can give feedback any time during the process. I gave feedback to every student once they had uploaded their video and made their v vs t graph. I caught lots of problems early enough that students could make corrections before they got too far along. Using Pivot Interactives makes it easy to give feedback because the video, data table, and graph for each student is uploaded immediately to Pivot Interactives. Students don’t have to email anything or share documents with me.
- Students can complete the entire activity in Pivot Interactives, including showing derivations, sketches, written analysis of their graphs, and answers to the three questions about the nature of the sliding friction between these surfaces.
- Final grading is also very easy. And…grades automatically pass back into the grade book with the Pivot Interactives LMS integration.
In my classes, I was doing fewer video analysis activities because the logistics of keeping track of videos, data and graphs, instructions, and students’ responses was daunting. Pivot Interactives streamlines this process, both for students and for teachers. I’m thrilled to be doing more analysis of student-made video again.